SUMM
ER '20

Lela Johnson (VCD MFA 2022) is the infographics editor at F Newsmagazine. She forgets the rest.

Illustration by Lela Johnson

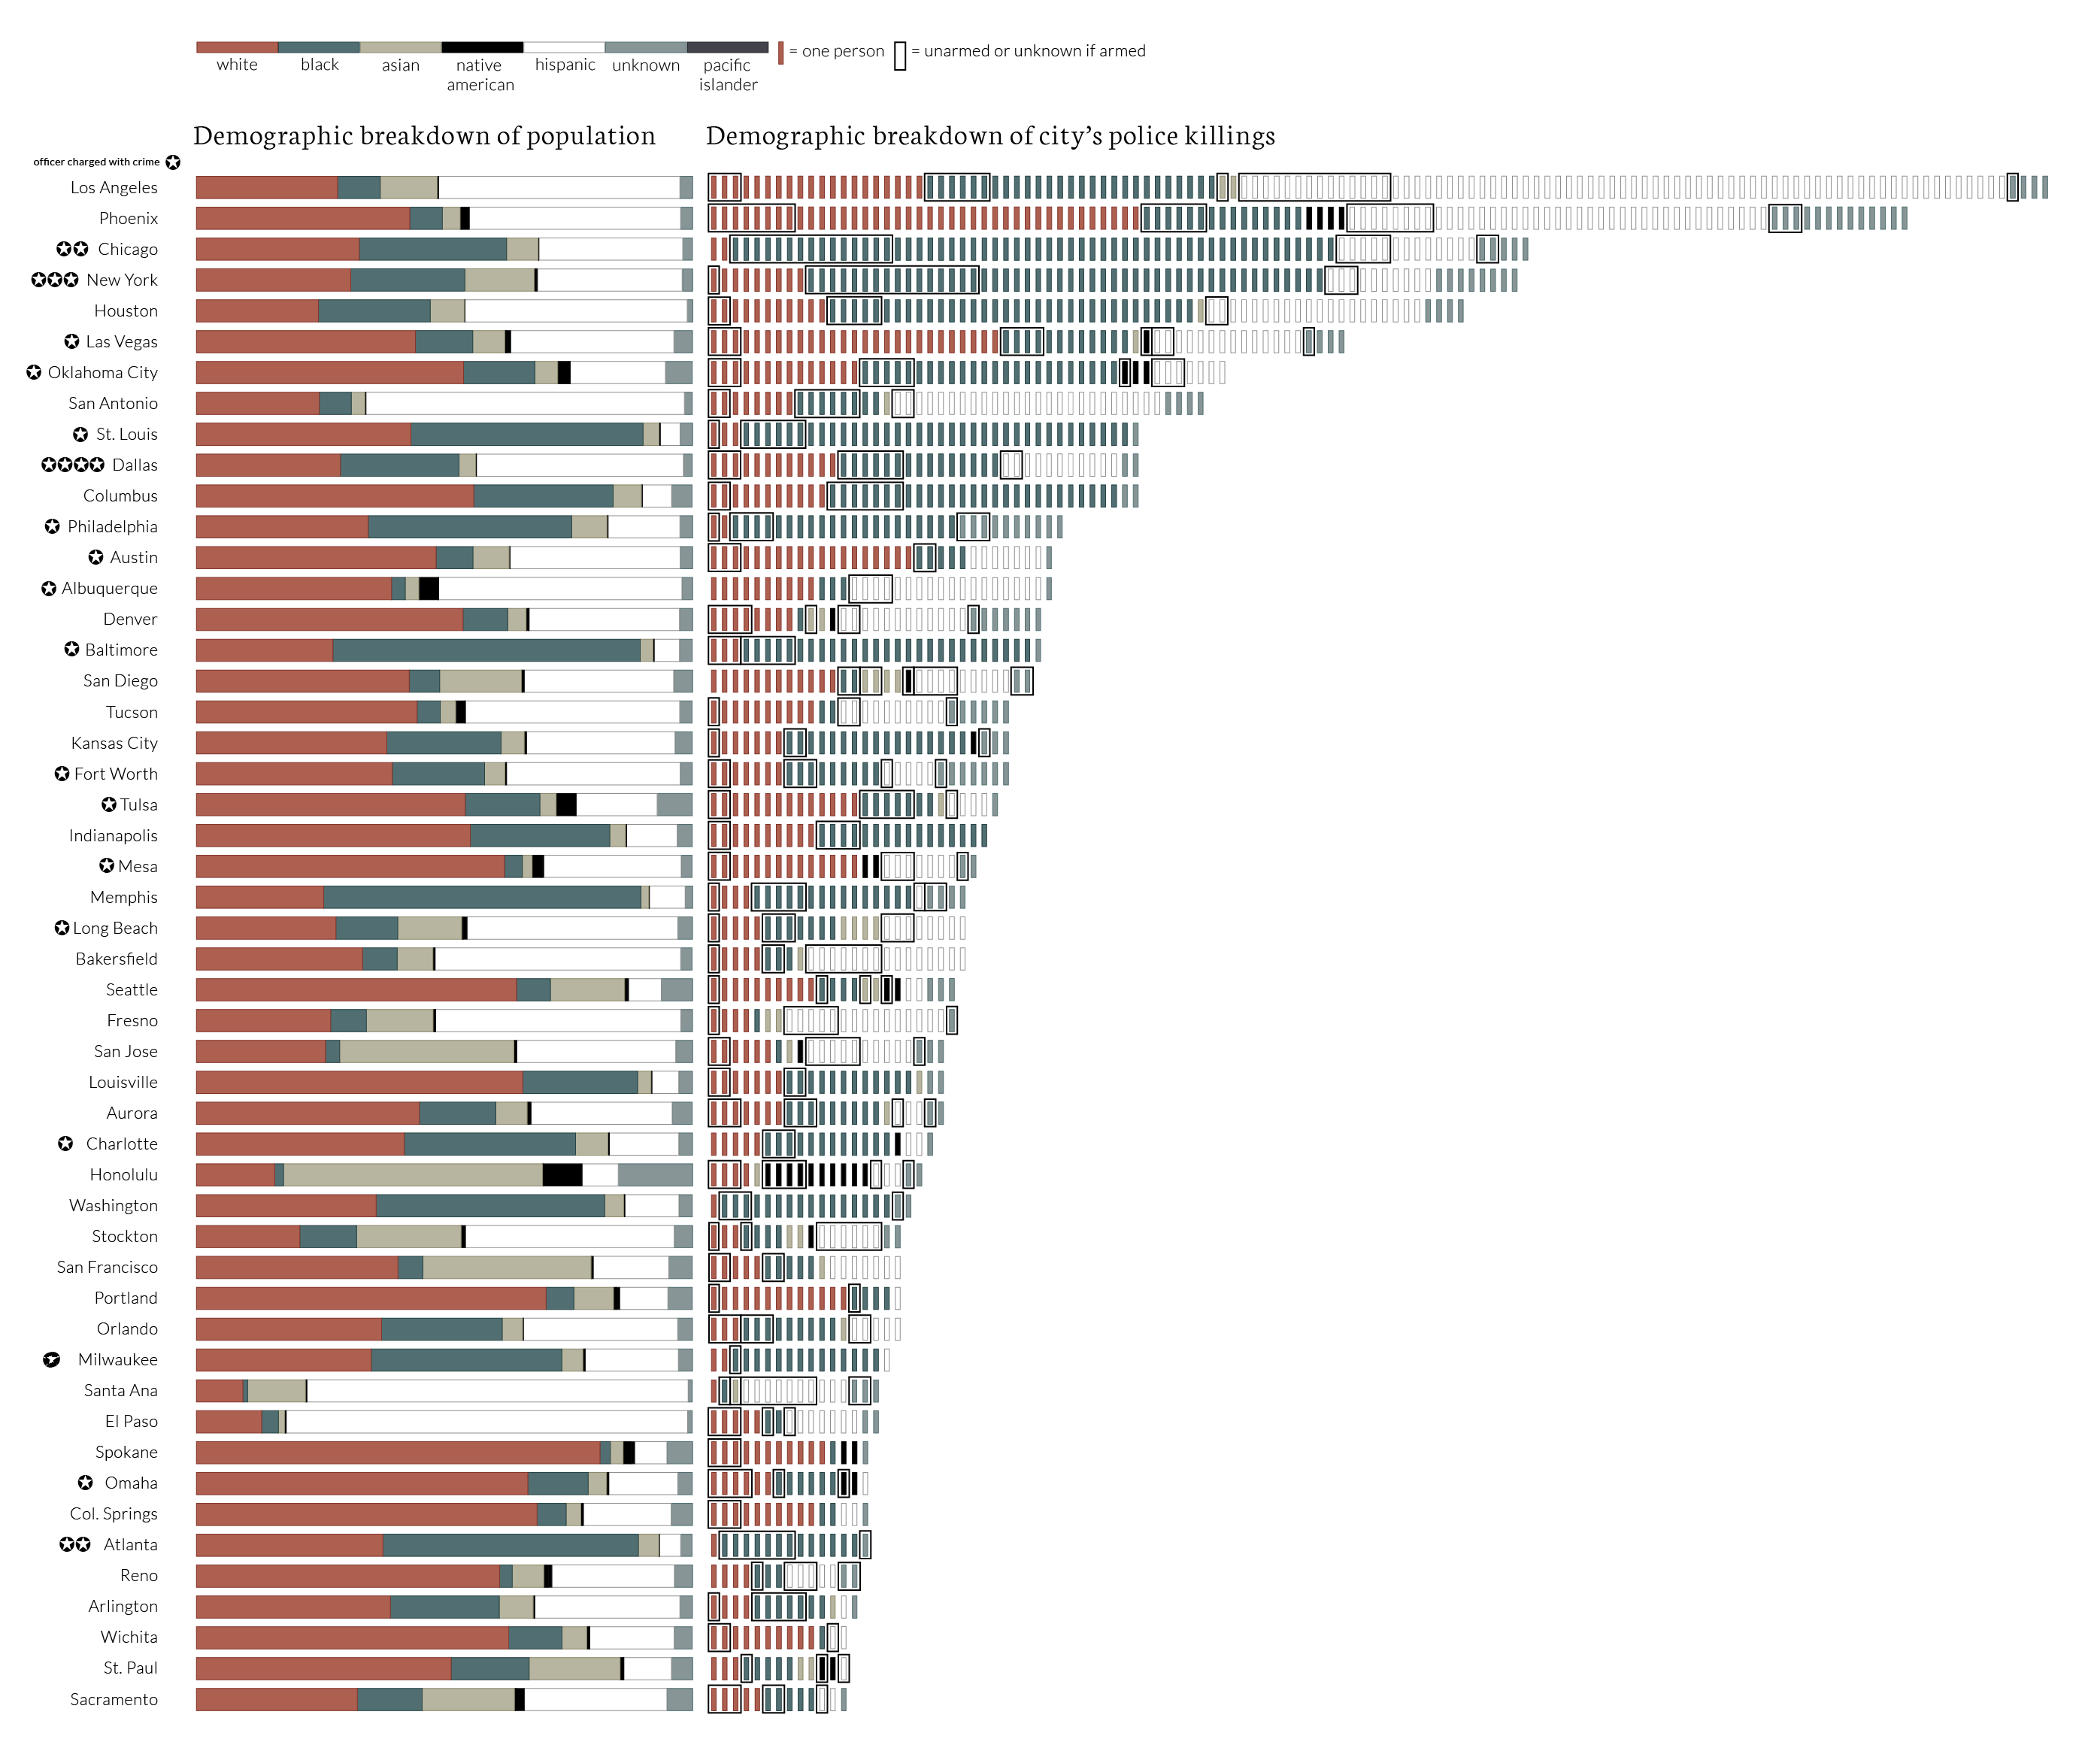
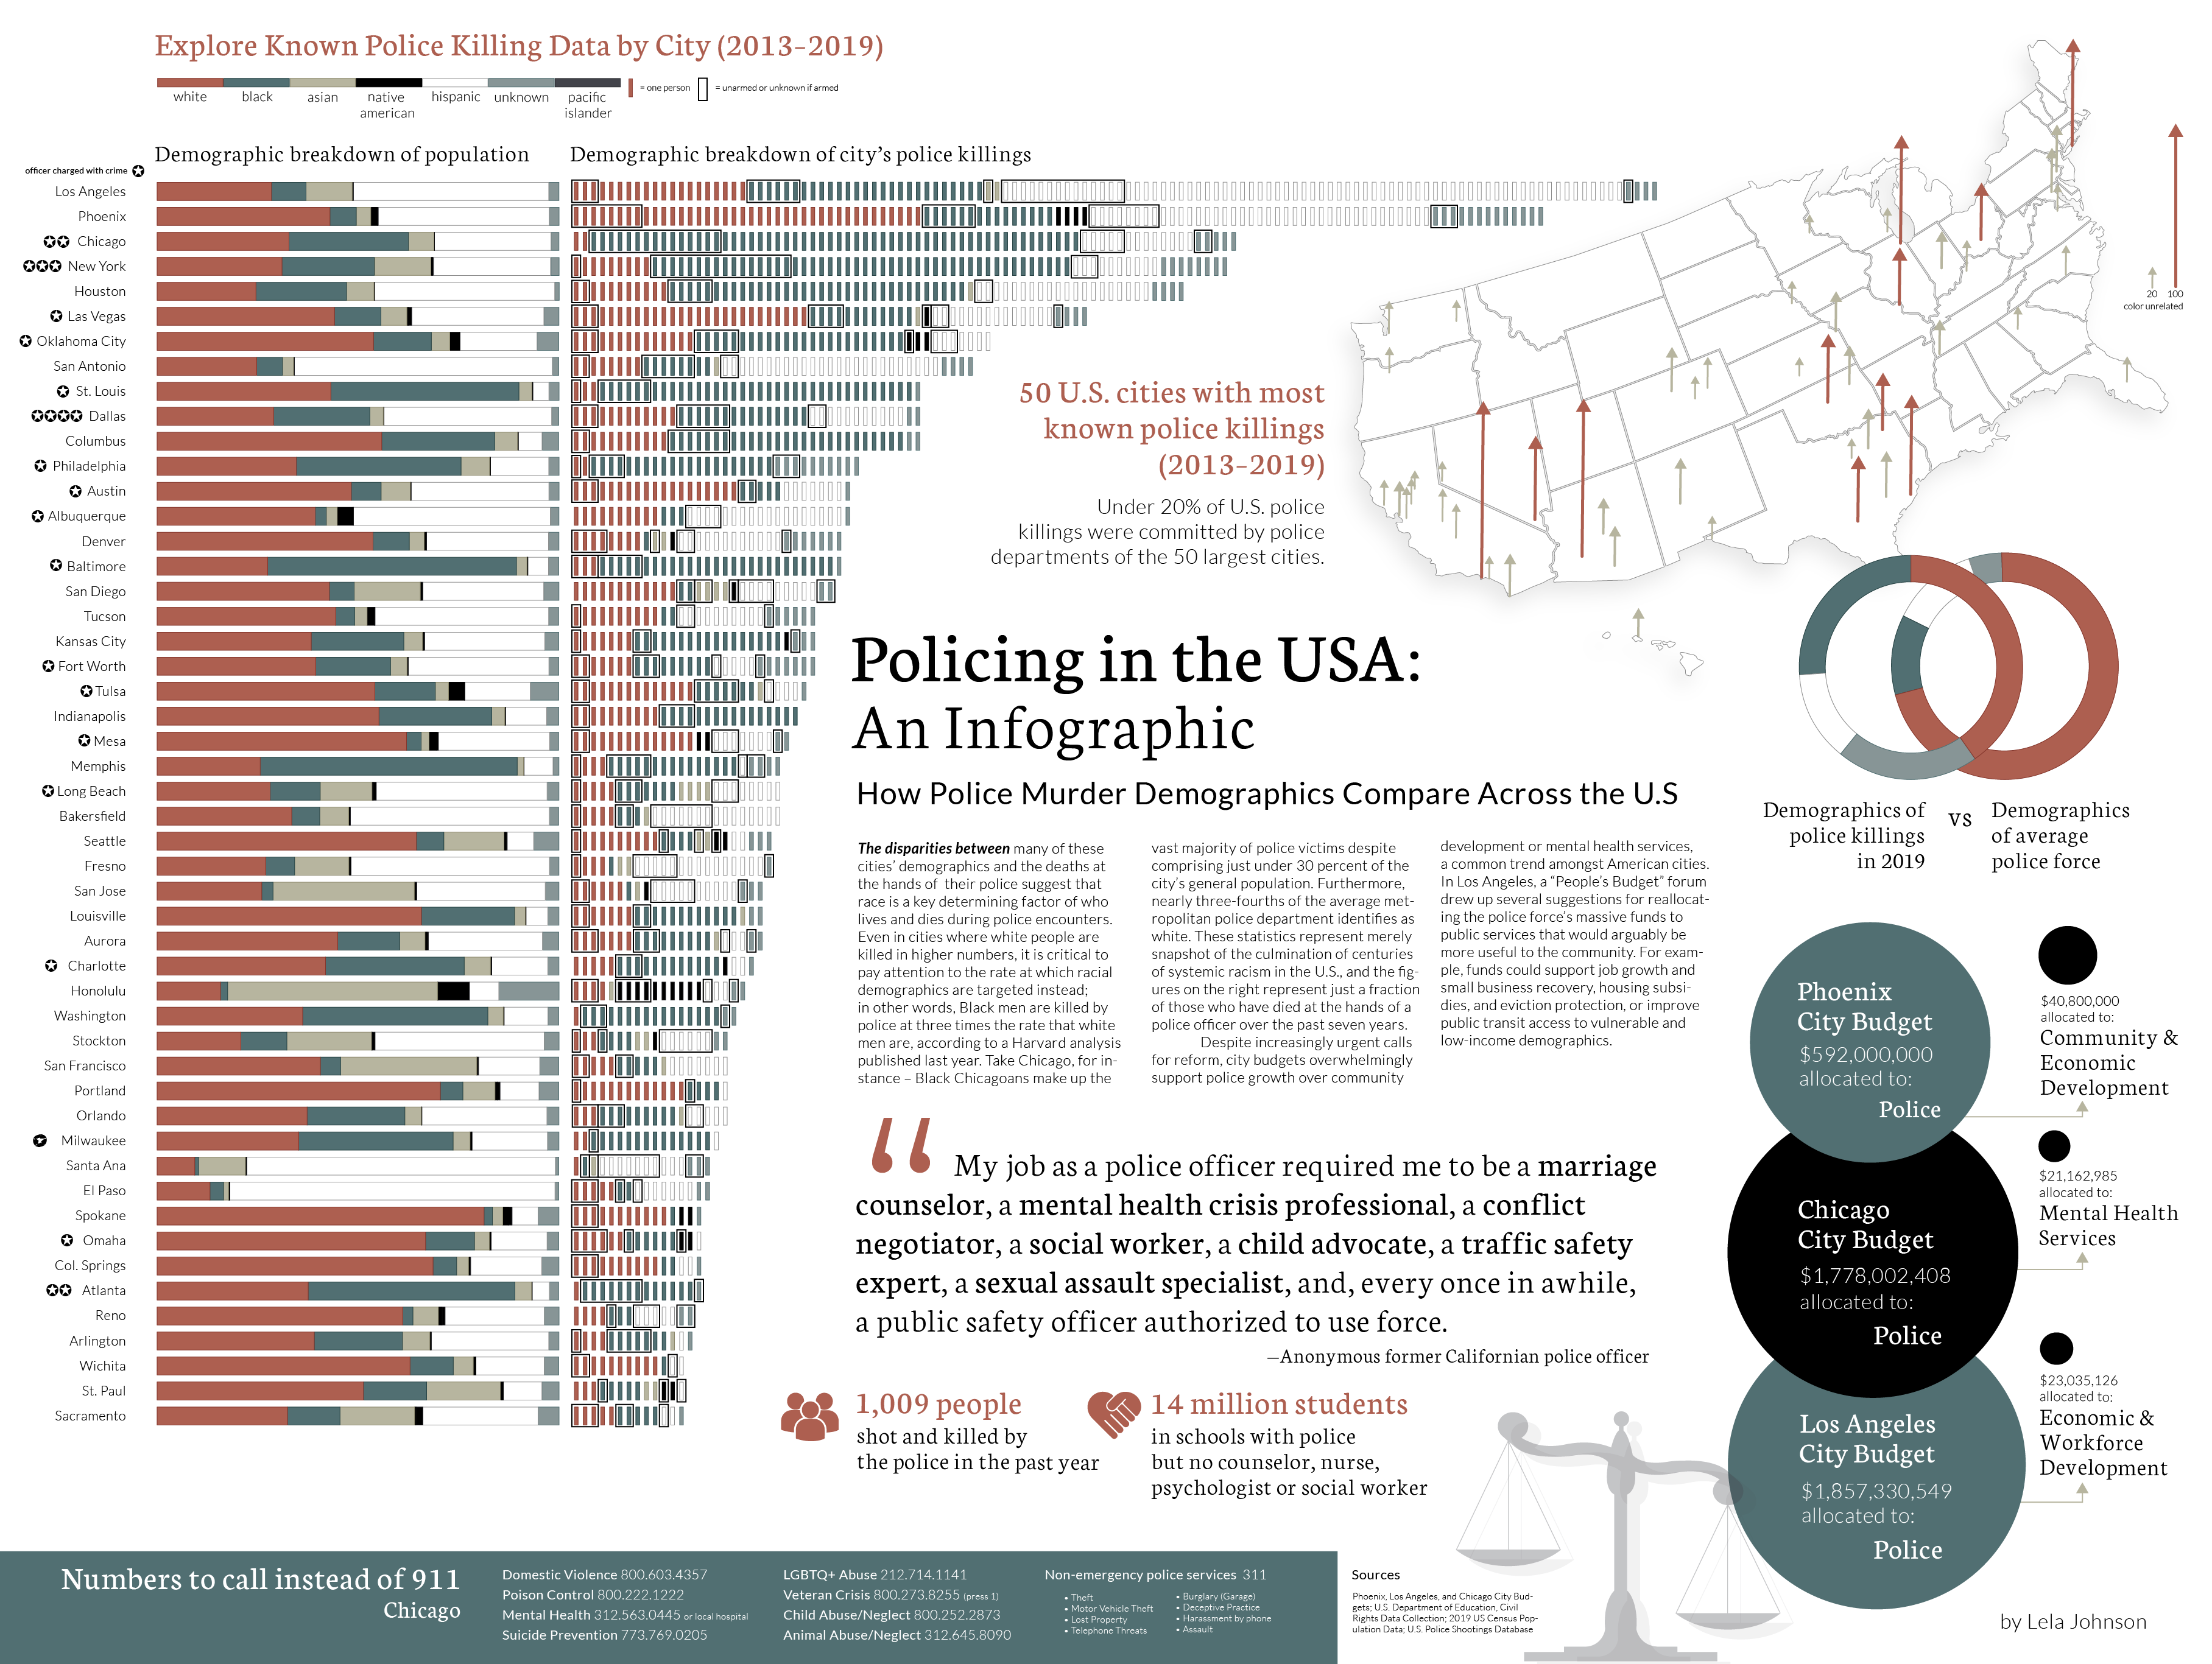
The disparities between many of the following cities’ demographics and the deaths at the hands of  their police suggest that race is a key determining factor of who lives and dies during police encounters. Even in cities where white people are killed in higher numbers, it is critical to pay attention to the rate at which racial demographics are targeted instead; in other words, Black men are killed by police at three times the rate that white men are, according to a Harvard analysis published last year.

Explore Known Police Killing Data by City (2013–2019)

EXPAND

Take Chicago, for instance: Black Chicagoans make up the vast majority of police victims, despite comprising just over 30 percent of the city’s general population.

50 U.S. cities with most known police killings (2013–2019)

Under 20 percent of U.S. police killings were committed by police departments of the 50 largest cities.

Furthermore, nearly three-fourths of the average metropolitan police department identifies as white. These statistics represent merely snapshot of the culmination of centuries of systemic racism in the U.S., and the figures on the right represent just a fraction of those who have died at the hands of a police officer over the past seven years.

“My job as a police officer required me to be a marriage counselor, a mental health crisis professional, a conflict negotiator, a social worker, a child advocate, a traffic safety expert, a sexual assault specialist, and, every once in awhile, a public safety officer authorized to use force.”

—Anonymous former police officer from California

Despite increasingly urgent calls for reform, city budgets overwhelmingly support police growth over community development or mental health services, a common trend throughout American cities.

In Los Angeles, a “People’s Budget” forum drew up several suggestions for reallocating the police force’s massive funds to public services that would arguably be more useful to the community. For example, funds could support job growth and small business recovery, housing subsidies, and eviction protection, or improve public transit access to vulnerable and low-income demographics. f

Numbers to call instead of 911

National Domestic Violence Hotline
800.603.4357
Poison Control
800.222.1222
NAMI Chicago
(Mental Health)
312.563.0445
NYC Anti-Violence Project (LGBTQ Abuse)
212.714.1141
Veteran Crisis
800.273.8255
Child Abuse
800.252.2873
Suicide Prevention
773.769.0205
Anti-Cruelty Society Chicago (Animal Abuse)
312.645.8090
Sources: Phoenix, Los Angeles, and Chicago City Budgets; U.S. Department of Education, Civil Rights Data Collection; 2019 US Census Population Data; U.S. Police Shootings Database
Download infographic here:

Related Articles